Publication-ready package —— PyX
X.-Z. CHEN, 05/06/2024, EIT, Ningbo
Short introduction
Summary
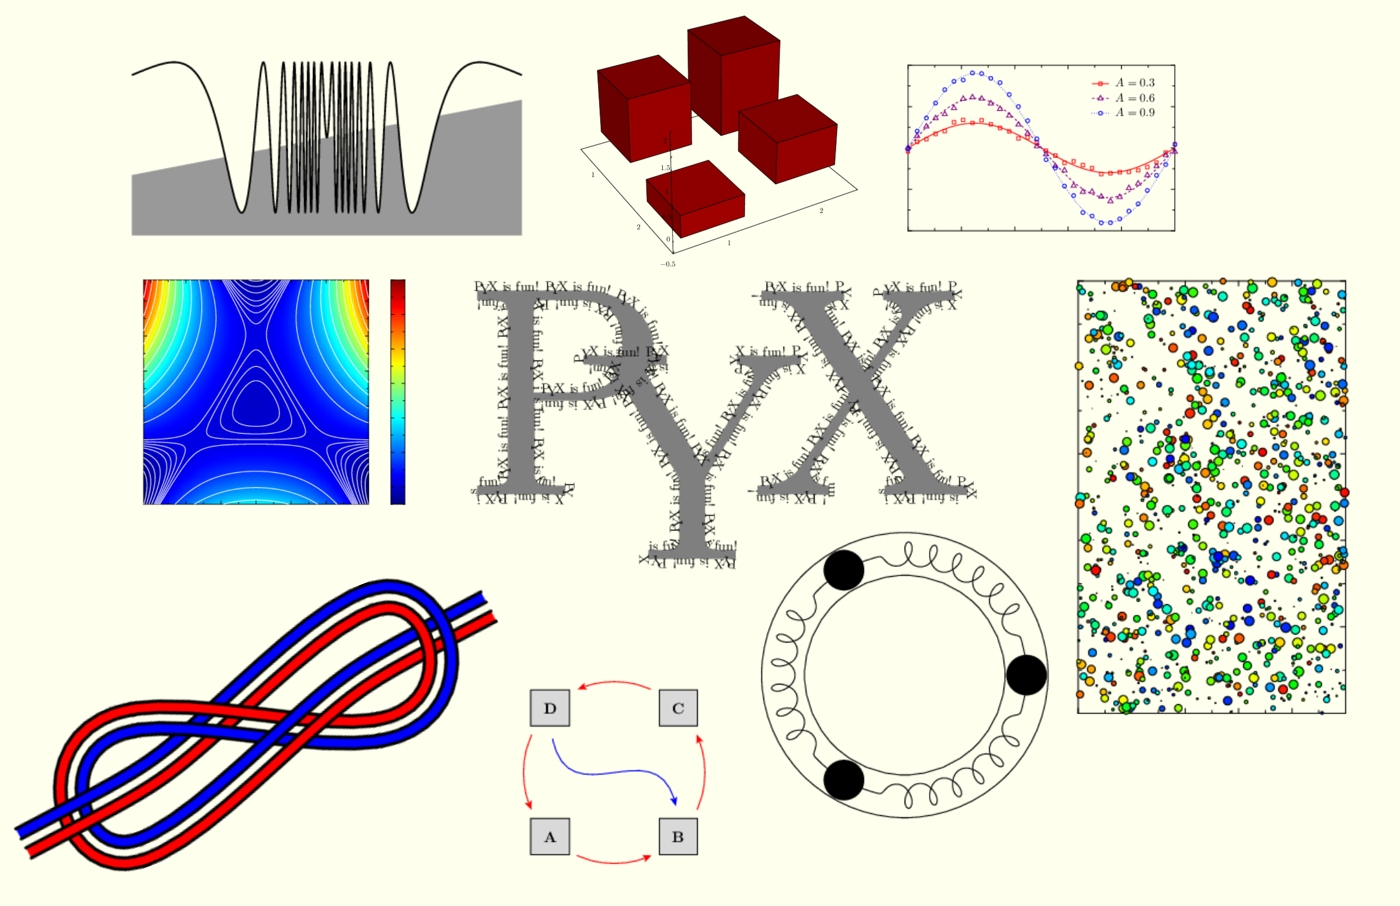
PyX is a Python package for the creation of PostScript, PDF, and SVG files. It combines an abstraction of the PostScript drawing model with a TeX/LaTeX interface. Complex tasks like 2d and 3d plots in publication-ready quality are built out of these primitives.
Features
- PostScript, PDF, and SVG output for device independent, freely scalable figures
- seamless TeX/LaTeX integration
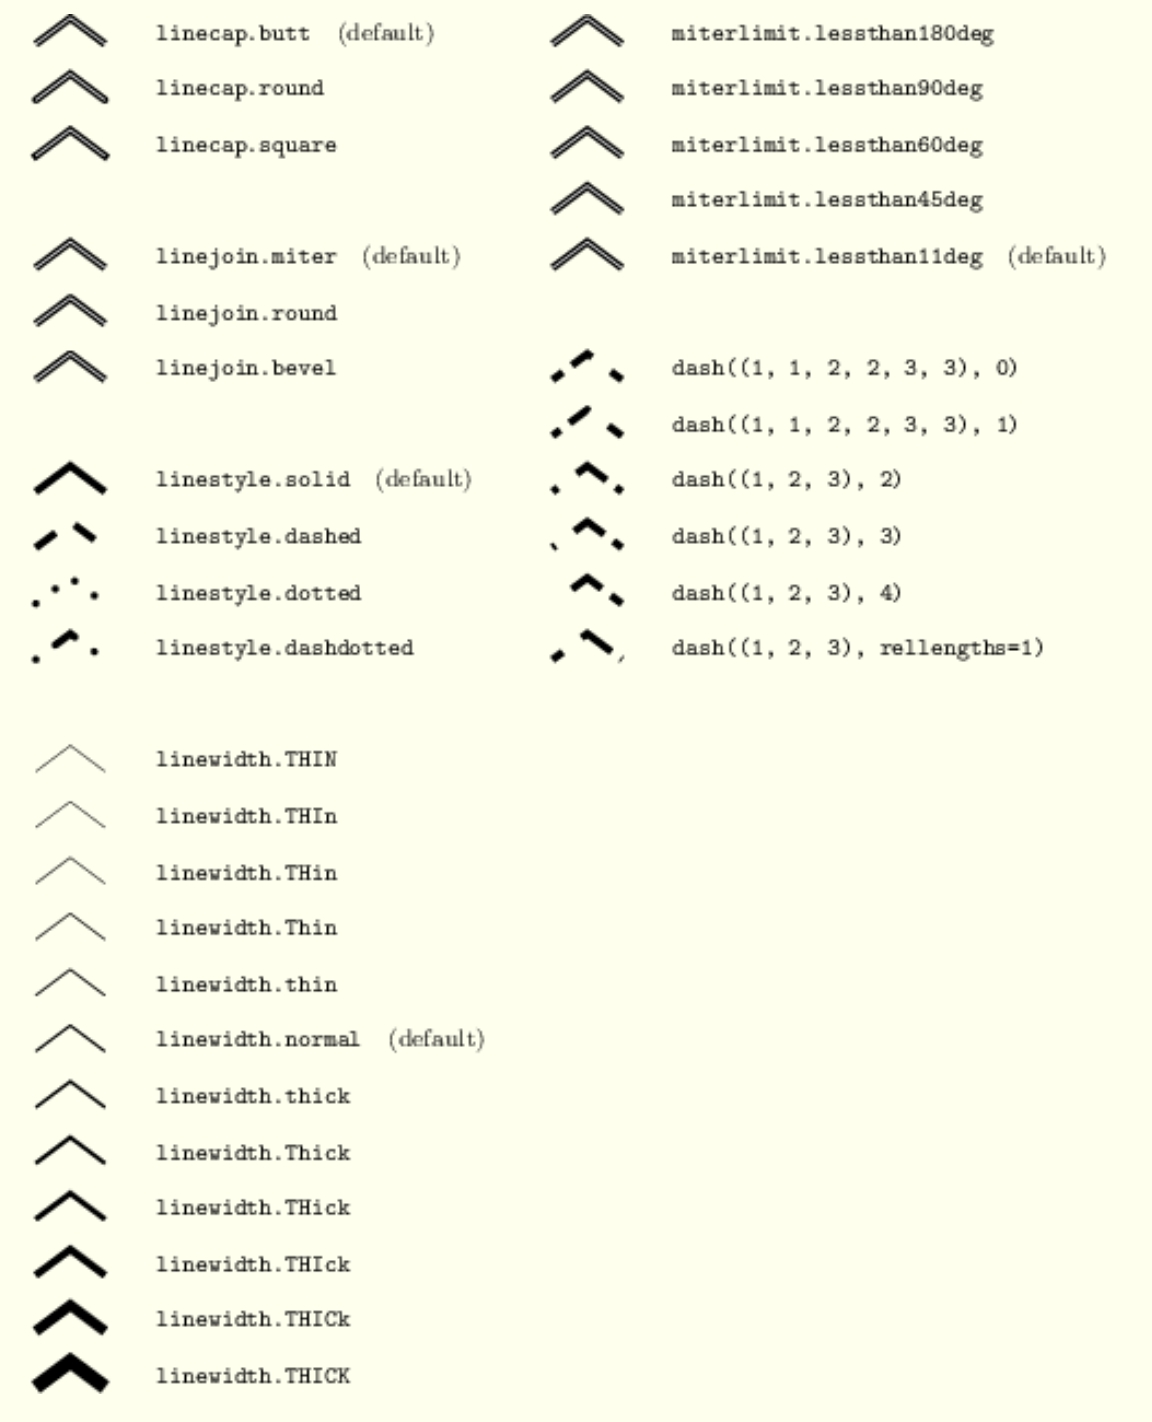
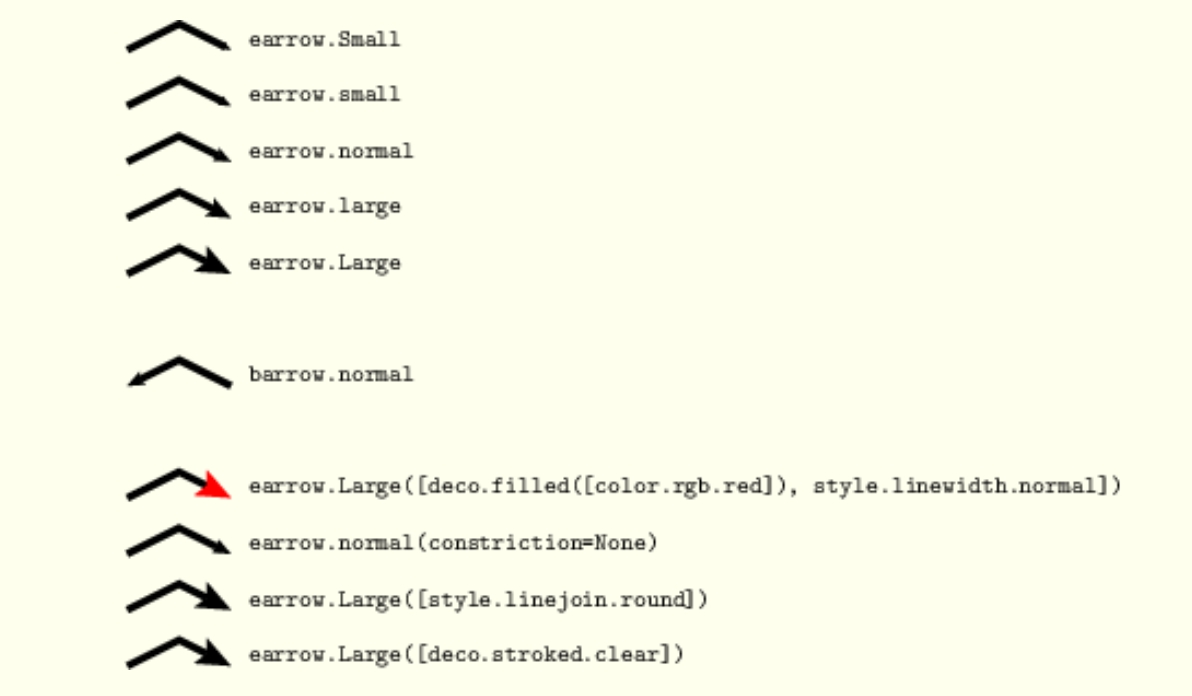
- full access to PostScript features like paths, linestyles, fill patterns, transformations, clipping, bitmap inclusion, etc.
- advanced geometric operations on paths like intersections, transformations, splitting, smoothing, etc.
- sophisticated graph generation: modular design, pluggable axes, axes partitioning based on rational number arithmetics, flexible graph styles, etc.
Status and Availability
PyX is in steady development. Planned features are listed on the roadmap. The current release, PyX 0.16, is available at the PyPI project page.
For more information, please visit PyX website
How to use it?
Basic examples
Basic examples can please visit PyX basic examples
Some useful forms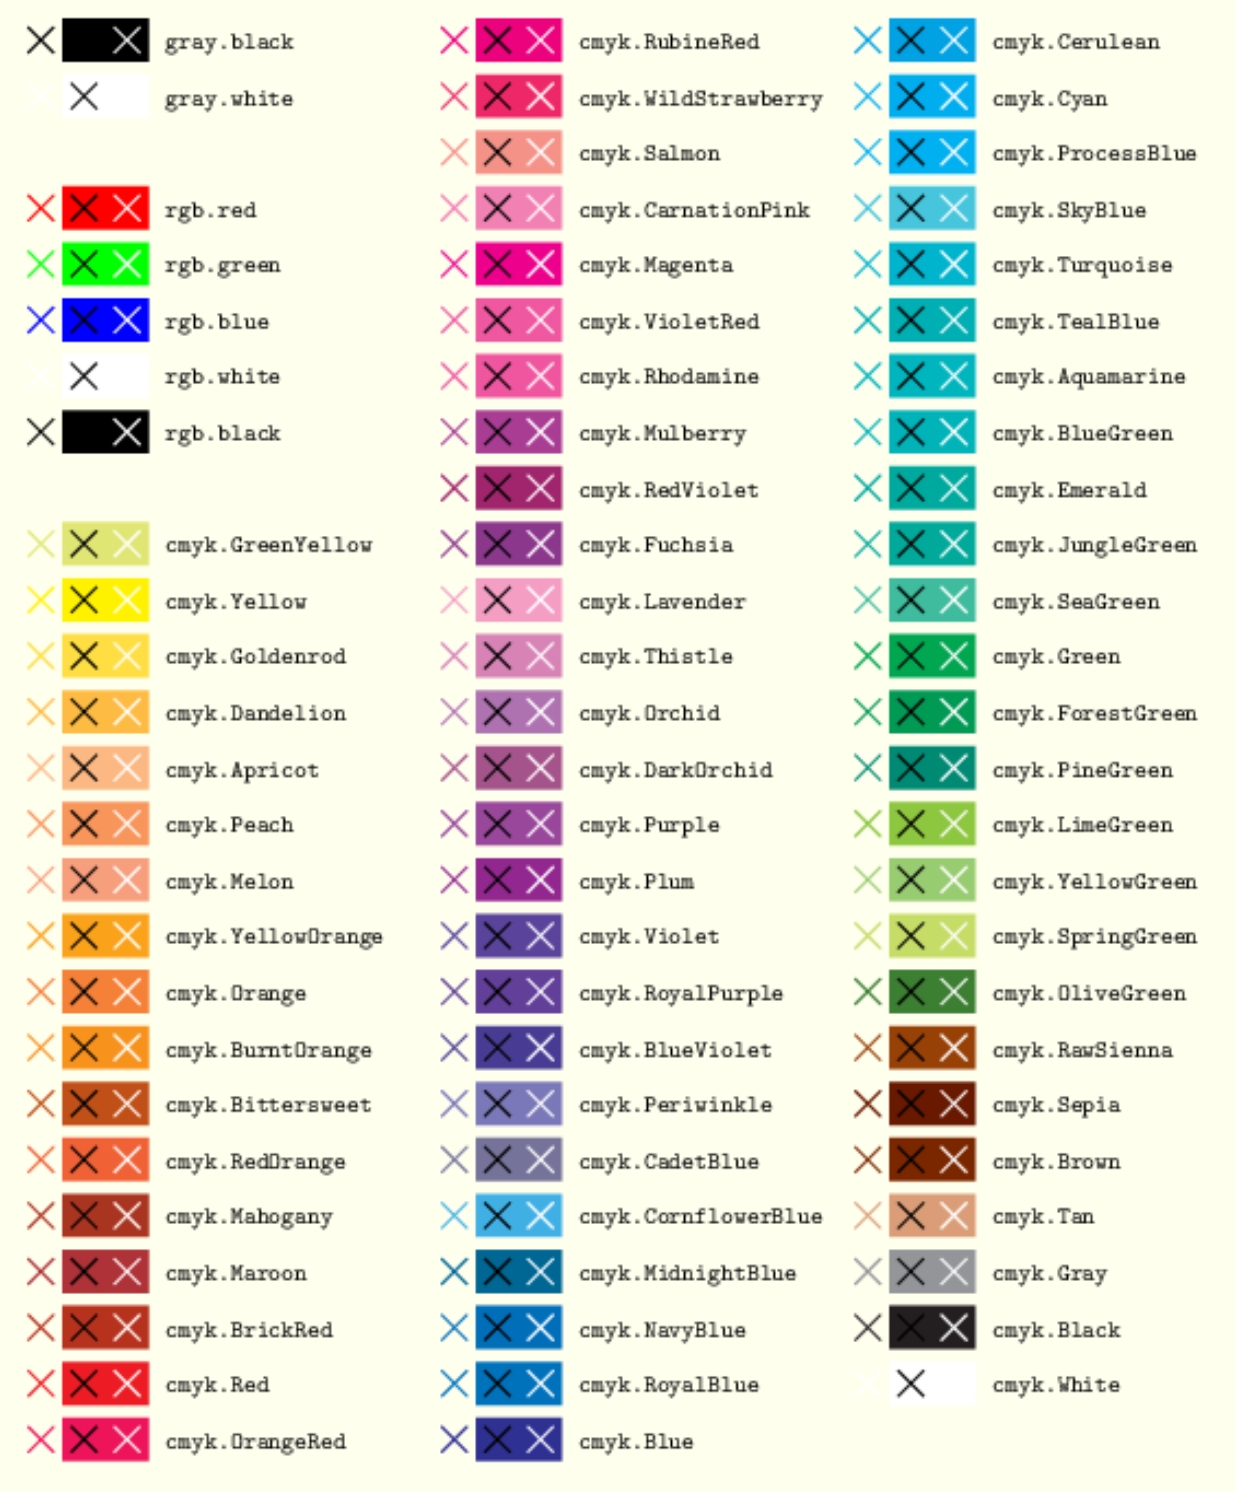
Advanced tips and tricks
example1: change the colorbar
In PyX, the colorbar is defined by function (not a series of discretized values), thus it will vary smoothly. The basic colorbars as follows:
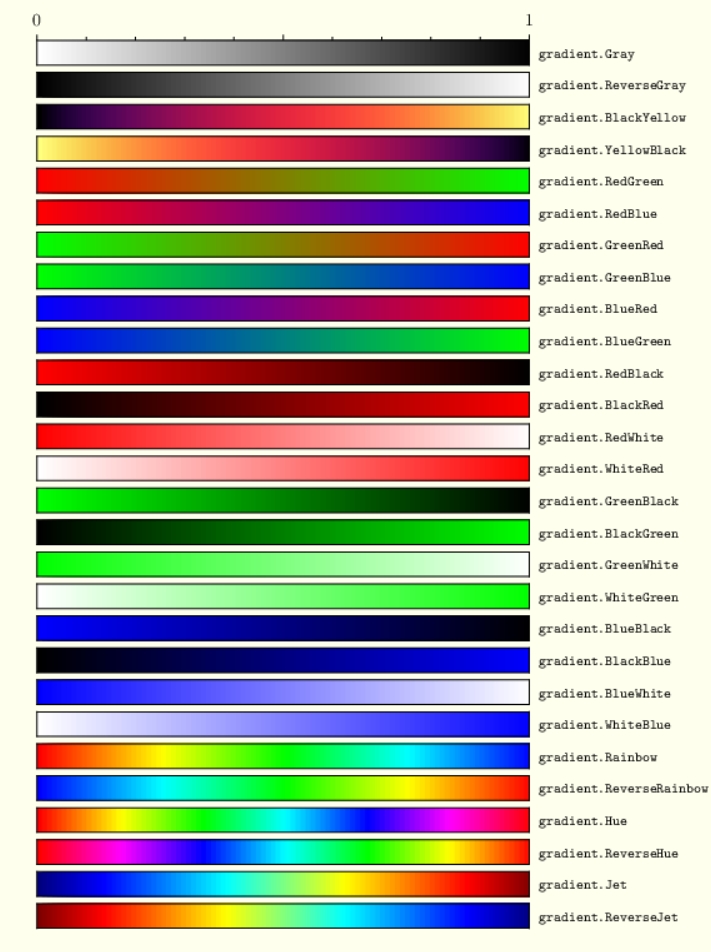
But it looks not very rich, and lack the classical red white blue colorbar, how to create it? The method as follows:
colorbarself_bwr = color.functiongradient_rgb(
    f_r=lambda x:  4.9*(1-x)**4 - 10*(1-x)**3 + 4.9*(1-x)**2 - 0.58*(1-x) + 0.9,
    f_g = lambda x: 13*(1-x)**4 - 26*(1-x)**3 + 13*(1-x)**2 - 0.15*(1-x) + 0.2,
    f_b = lambda x: 6.4*(1-x)**4 - 13*(1-x)**3 + 6.3*(1-x)**2 + 0.99*(1-x) + 0.054
    )

In principle, you can constructe any colorbar you have seen through this method.
example2: plot subplots()
example3: fix labels
xlabel,ylabel
subplots() label